The assignment is to identify two web maps and two static maps and determine the appropriateness of the medium for internet use.
Geological maps often start as topographic maps. Topographic maps are available for download from the USGS. There is a fee for most of the maps.
My Geology 111 students use the Fredericksburg quadrangle to practice their map skills. That map can be viewed here. You can see in the image below, that this is not an ideal map for the web.
There is a lot of detail on this map, but I can’t see that detail on my monitor. The contours are barely visible. I ask my students to count contours to estimate change in elevation. This would be impossible if they had to do it on a laptop screen.

When I was a student, I used topographic maps to make geologic maps – maps that show rock units. This is an image of a paper geologic map of Virginia stolen from VirginiaPlaces.org.

I can see the entire map on my laptop screen. I can interpret and understand the information. But, it could be much, much better.
The USGS has created an interactive geological map of the U.S. With this map, it is possible to zoom in to a state or county and see the geology of an area in increasing detail. This is the Fredericksburg area. I was able to add County names and information from Google Earth, so I could determine where the rocks are located. 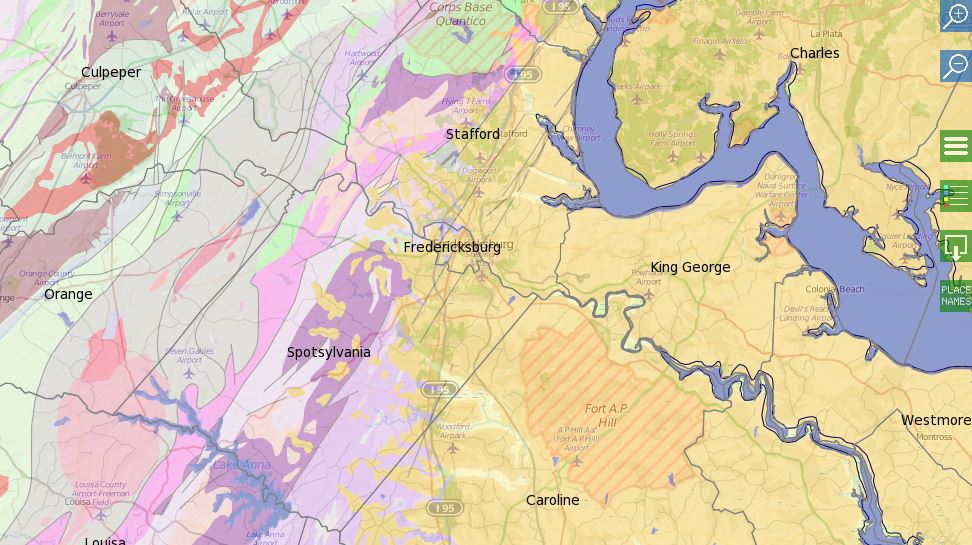
This is great and very easy to use, but it only shows one type of information. What if I want to know about rocks and climate? One of the benefits of using a computer to view maps is that multiple types of information can be stored and viewed on one map.
The USGS and esri worked together to create the “Ecological Tapestry of the World“. This interactive map shows rock type, but it also shows bioclimates, landforms,and land cover – all at a 250 meter resolution.
Here’s Fredericksburg.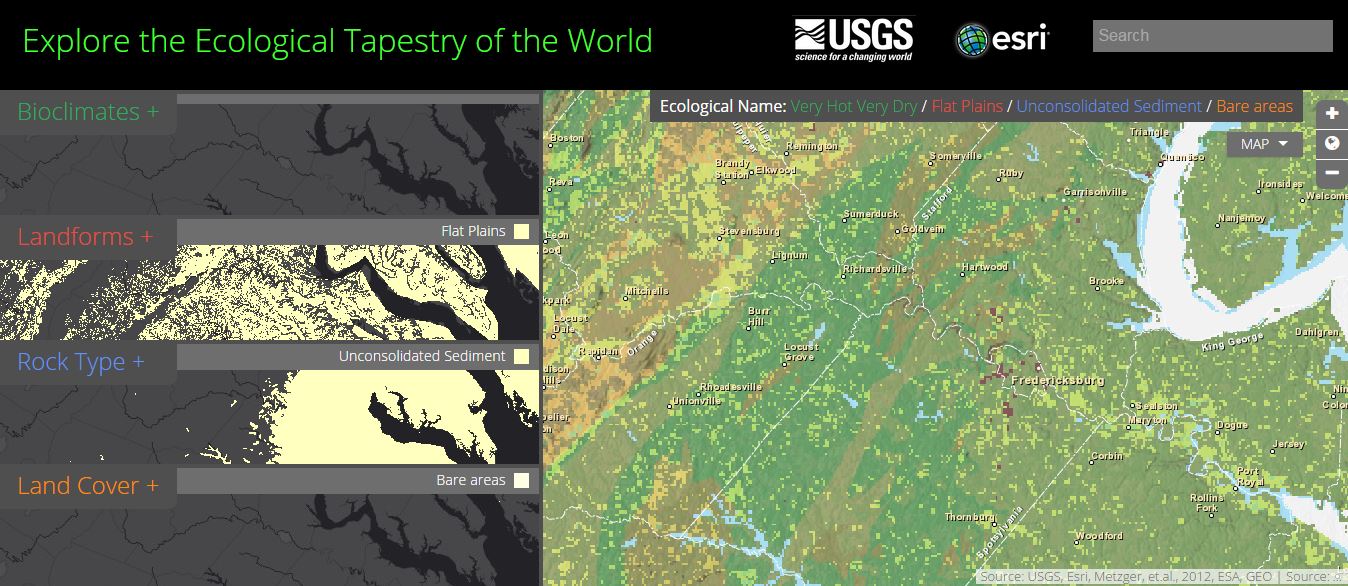
The information is also available as a layer in ArcGIS online.
