After an Earthquake – Tweet

Yesterday (10/15/2015), was the day for Great ShakeOut Earthquake Drills. At 10:15 a.m., I was lecturing about volcanoes, when my slides were replaced with an earthquake drill announcement. I told my students that if an actual earthquake were to happen, they should duck under their desks and stay there until the shaking stopped. Then we went back to volcanoes.

While I was talking about what to do in the event of an earthquake, my children practiced ducking under their desks. Worldwide, more than 22 million people participated in yesterday’s earthquake drills. They learned to drop, cover and hold on. But, they didn’t learn what to do once the shaking stops.

Perhaps one of the most helpful things to do after an earthquake is to tweet about it. USGS seismologist Paul Earle teamed up with USGS computer scientist Michelle Guy to develop a method to use tweets to track and detect earthquakes.

Earle and Guy were able to create a time series algorithm that determined when an earthquake occurred by detecting posts that mentioned earthquakes. This was helpful, but after looking at posts in more detail they noticed two things:

  1. People who were affected by earthquakes kept their initial posts very short.
  2. People who experienced the quake first hand were less likely to share links or discuss the magnitude of the earthquake.

So, the USGS team decided to filter out tweets with more than seven words, tweets with links, and tweets with numbers. They created filters in many languages.

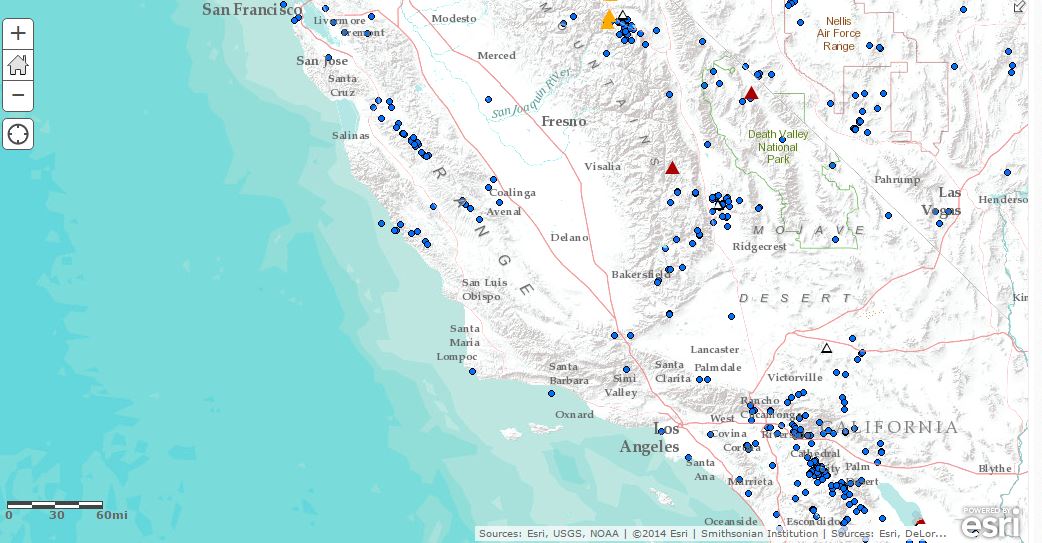
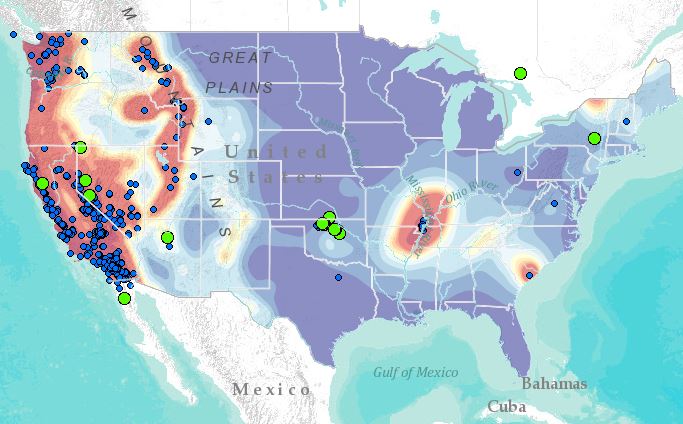
The USGS has about 2,000 earthquake sensors – most are in the United States. The sensors will detect earthquakes, but it can take several minutes or longer for the seismic waves generated by an earthquake to travel through the Earth and reach a sensor. Scientists need several sensor measurements to triangulate an earthquakes epicenter.

Twitter has more than 300 million users per month. Within 30 seconds, tweets about an earthquake can spread around the world. There is little cost for this information as it uses Twitters Public API and open-source software.

While tweets won’t replace sensors and seismometers, they do provide additional information that can be used for emergency response and damage assessment – especially in areas that don’t have a lot of seismometer coverage.

For more information, click here.

To learn about how social media helped provide information after the Nepal earthquake, click here.

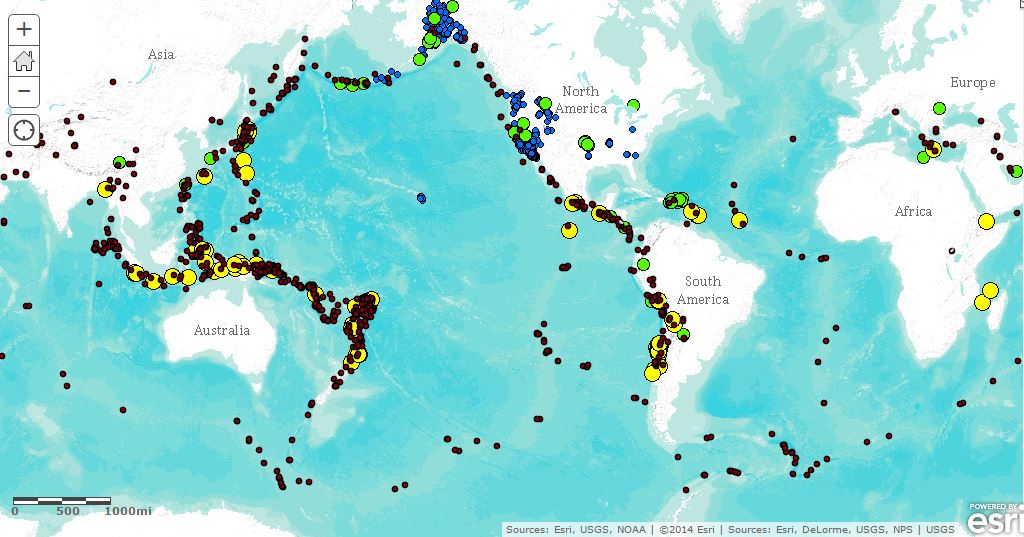
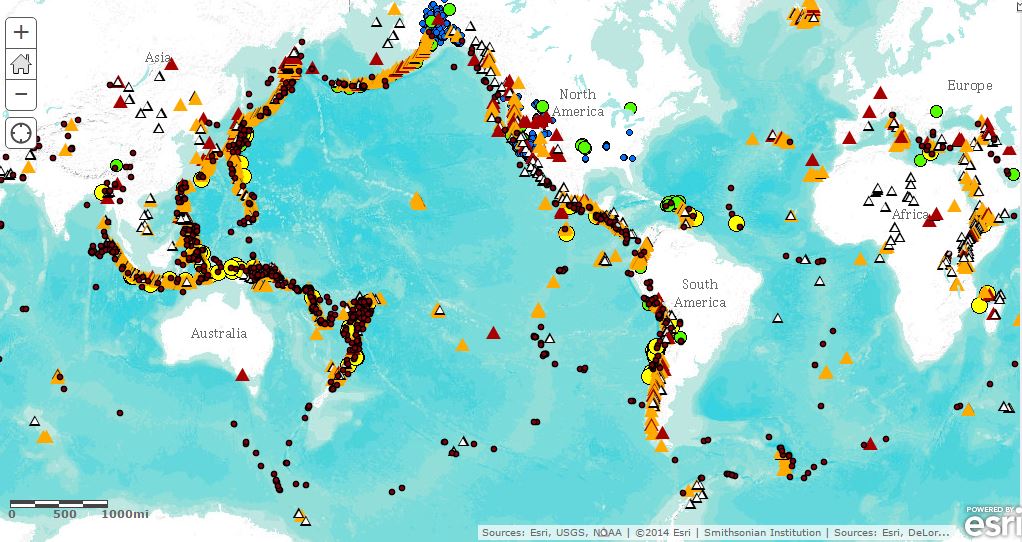
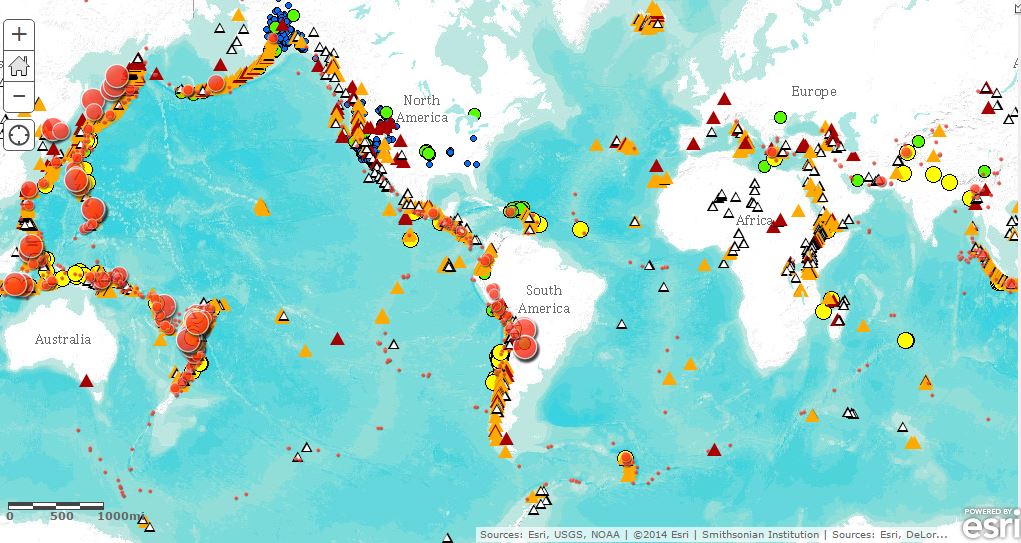
Here are several earthquakes that occurred in Chile on September 25, 2015.

ChileQuake

Here are the Twitter statistics. Source: https://blog.twitter.com/2015/usgs-twitter-data-earthquake-detection

twitterquake-stats

Seismogram image of vertical displacement at Las Campanas Astronomical Observatory, 8.3 magnitude earthquake, 9-16-2015. Source IRIS

On Shaky Ground 2: How Earthquakes Teach Us About Geology

My first earthquake was the Loma Prieta earthquake on October 17, 1989. The 6.9 magnitude earthquake is also known as the World Series Quake because  millions saw the earthquake live on TV as they watched Game 3 at Candlestick Park.

The epicenter of the earthquake was located about 10 miles northeast of Santa Cruz on the Loma Prieta segment of the San Andreas fault system. I was on a commuter bus in Berkeley at the time; I didn’t feel a thing. But, many other people did.

More than 200 buildings were damaged in San Francisco’s Marina District. Forty-two people died when the upper level Cypress Street off-ramp of the Nimitz Freeway collapsed into the lower dock. Hundreds of Oakland residents were displaced when the buildings they lived in or worked in were closed because of structural damage.

Earthquakes are destructive. They cause property damage, injuries and loss of life. But, we can also learn a lot from earthquakes.

Earthquakes are caused by the interactions of tectonic plates. They generally occur at the boundaries where two or more plates meet. We can identify plate boundaries by mapping large amounts of earthquakes.

In this map, strong earthquakes from 2012-2014 are shown in red. Earthquakes from the last week are also shown.plateboundariesYou can see that most earthquakes occur in distinct bands. These bands outline the boundaries of Earth’s tectonic plates. The discovery that earthquakes occur in bands actually contributed to the idea of plate tectonics.

My students learn that there are three types of plate boundaries: divergent boundaries where plates move apart and new crust is formed; convergent boundaries where plates move together and oceanic crust is subducted or pushed down into the mantle; and, transform boundaries where plates move past each other. We can use earthquakes and volcanoes to determine the type of boundary at a map location.

When I added the Smithsonian Institutions Holocene volcanoes layer to the map, it looks like this. volcanoesThe yellow volcanoes are volcanoes that have been active over the last 10,000 years. As you can see, most of these volcanoes occur in the same area as earthquakes. There are some exceptions.

Volcanoes that occur far from plate boundaries are “hot spot” volcanoes. These form when crust travels over a mantle plume, an area in the mantle that is extra hot. Hawaii is a chain of hot spot volcanoes.Hawaii

There are also places where there are earthquakes an no volcanoes. The coast of California is one of those places.

CA

In California, the San Andreas fault marks a transform boundary where the Pacific Plate is moving past the North American plate. Volcanoes only occur at divergent and convergent boundaries. The volcanoes to the east are extinct leftovers from Basin-Range rifting (divergent boundary).

We can use earthquake depth to determine if a map boundary is convergent or divergent. In this map, depth is shown by the size of the circle. Deeper earthquakes appear larger.

deep

Shallow earthquakes (less than 75 km deep) often occur at mid-ocean ridges. These are long chains of underwater volcanoes where tectonic plates move apart and new crust is formed. Deep earthquakes occur at subduction zones where oceanic crust is being pushed under continental crust.

Oceanic-continental_convergence_Fig21oceancont

When this occurs, the subducting plate bumps and scrapes against the overriding plate. This causes deep earthquakes. When the subducting material reaches a depth of about 660 km, the rock becomes soft enough to flow and earthquakes stop.

Non-map images are from Creative Commons (Wikipedia). My map can be found here.

On Shaky Ground Part 1: Earthquakes in Virginia

It’s been just over four years since a 5.8 magnitude earthquake in the Central Virginia Seismic Zone damaged the Washington Monument. That was a significant earthquake for our area.

Last Sunday (9/27/15) the Central Virginia Seismic Zone experienced another earthquake.  The magnitude 2.0 quake was one of hundreds of small earthquakes that have occurred in the area over the past four years. And, InsideNova feels the need to report every single one.

So, is Virginia really a seismically active area? I placed esri’s USA Earthquake Risk map on top of a topographic base map. The map shows potential ground shaking intensity from earthquakes, an estimate of the amount of damage an earthquake is likely to cause in an area.  I set the scale so the highest risk in shown in dark red while the lowest risk appears as dark blue. I added the past week’s worth of earthquakes (from esri Disater Response) to the map. You can see the our 2.0 quake in Central Virginia.

Seismic zones

Moost of Virginia falls in the medium blue range indicating a very low risk of damage from earthquakes. Our recent earthquake is small compared to the many of the other earthquakes that occurred in the U.S. last week.

It’s not surprising that the West Coast of the United States is covered in red and orange. The California, Oregon, and Washington coasts are active margins. This means that the edge of the continent coincides with the edges of one or more tectonic plates (in this case: North American, Juan de Fuca, Pacific). Geologic activity such as earthquakes and volcanoes generally occurs at the edges of tectonic plates.

The East Coast is a passive margin. The eastern edge of the North American tectonic plate is far out in the Atlantic ocean. So, geologic activity on the East Coast and most of the U.S. is relatively rare as indicated by the blue coloring.

Behind California is an area known as the Basin Range province. This is the remnant of an ancient rift zone. In the early Miocene (about 17 ma), the North American continent began to stretch and thin. But, before the continent could rift into two tectonic plates, seismic activity stopped. This left a network of faults which still responds to the stresses from activity on the West Coast. The New Madrid fault zone which underlies Alabama, Arkansas, Illinois, Indiana, Kansas, Kentucky, Mississippi, Missouri, Oklahoma, Tennessee and Texas is another example of an ancient rift zone.

But, not all rift zones are ancient. The red area in Northern New York and New Hampshire indicates activity from the St. Lawrence rift system, an active rift zone that runs along the St. Lawrence River. Perhaps one day, North America will split and a new Canadian plate will form.

If you are looking carefully you might notice that there are medium blue areas in the middle of continents far from any plate boundaries that have recently experienced larger earthquakes. Is that rifting? Does that mean we should worry?

No, it’s not rifting, but we may have reasons to worry. The cluster of earthquakes in Oklahoma includes several with a magnitude between 2.0 and 3.0. These small earthquakes have been linked to fracking rather than seismic activity. The 3.2 earthquake near Stamford, NY may also be caused by human activity. It is likely the result of water pressure from the Gilboa Dam.

Like Oklahoma and New York, Virginia has networks of ancient faults that can be reactivated by human activity. However, seismologists believe that most of our earthquakes are simply the result of old faults moving because of sea floor spreading in the Atlantic Ocean.

You can view my map here.