This semester, I’ve been working with Dr. Kenton Ross, the national science advisor at NASA DEVELOP, to understand the spectral properties of Alexandrium monilatum. I am using aspects of this work as my term project for GIS 295 and GIS 255.
In Harmful Algal Blooms – Part 5: Trouble in Data Land, I discussed the challenge of completing a mapping project when the data has lost its geospatial reference. However, we were able to obtain approximate locations for each hyperspectral scene by estimating pixel size and lining up the time field in the hyperspectral data with the time field in the the flight path data set. You can see the scene center lines in black on the image below.

The water in this map looks unusual. NDVI is a band ratio index used to indicate vegetation. I used ((Landsat 8 band 5 – band 4)/ (band 5+band 4)) to mask out the land in ArcGIS. I then clipped out the unmasked water and used false color imagery (bands 6, 5 and 4) to enhance different features of the water. The water on the right side looks thick and yellow because it is very turbid.
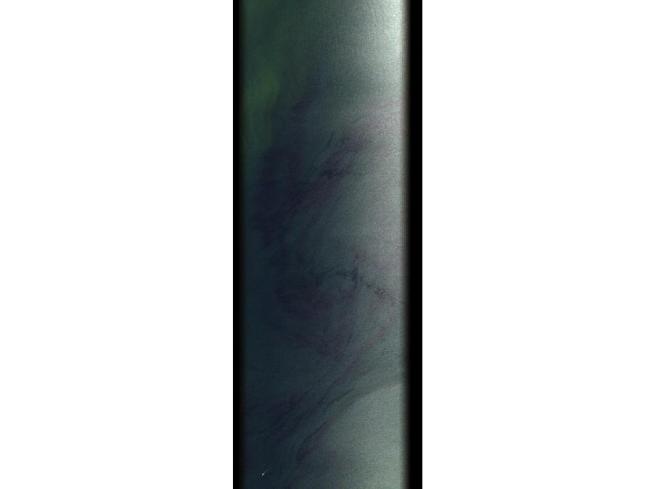
Once I knew where each scene was located, I analyzed each hyperspectral image individually. This is York scene 5.

The first thing I noticed was that any detail was hard to see. That’s because one side is in shadow. So, I clipped out the black edges and the bright, overly illuminated right side of the image. I also reduced my number of bands from 283 to 13 carefully selected bands in order to reduce noise and maximize the spectral signal. The resulting image is in the slide below.

The deep red swirl is the algal bloom.
I used bands 146 (710 nm), 128 (665 nm) and 85 (559 nm) to create a NIR, red, green false color composite to highlight areas with high chlorophyll. That’s the second image in the slide.
High chlorophyll should appear red in these images, but the areas of intense blooms appeared bright yellow-green. This is because there is also a red pigment in the blooms that gives them their color.
The third image is estimated chlorophyll. I used the ratio of band 146 (710 nm) over band 128 (665 nm) as a proxy for chlorophyll-a. Red and yellow indicate high chlorophyll, while dark blue indicates low chlorophyll. You can see that despite the red color, the algal bloom has plenty of chlorophyll.
What about the third image? I used ENVI to run an unsupervised classification. This means that ENVI sorted the pixels in the image into five groups according to their spectral properties. I then used class statistics to obtain the spectral signature of each group. That’s the big image on the left of the slide.
I repeated this procedure on seven images from the York River, four images from the James River, and one image from Mobjack Bay. The signatures in the York River were distinctive enough that we believe we are on the right track to find the spectral signature of Alexandrium monolatum.
For my GIS 295 class project, I created an web app which shows the imagery and spectral signatures at each scene. If you are a member of Northern Virginia Community College GIS group, you can access the app here. Everyone else will have to wait until we are ready to make the app public.
References:
Moses, Wesley J.; Gitelson, Anatoly; Perk, Richard L.; Gurlin, Daniela; Rundquist, Donald C.; Leavitt, Bryan C.; Barrow, Tadd M.; and Brakhage, Paul, “Estimation of chlorophyll-a concentration in turbid productive waters using airborne hyperspectral data” (2012). Papers in Natural Resources. Paper 313. http://digitalcommons.unl.edu/natrespapers/313
This is a really interesting research and write up you’ve done Sara, fine job done! I was a bit surprised when you mentioned during your presentation for GIS 255, that there is little research done or knowledge known for one of the algae that is blooming. Hopefully attention is turned to climate change soon so that their impact can be either minimized or mitigated and stopped entirely
LikeLike
Very impressive research, write up and presentation, Sara. Thank you for bring attention to this area of concern. Today, I came across an article in Washington Post (Section C10) that talked about how domoic acid produced by marine algae is harming California sea lions, causing brain damage.
LikeLike